EGF yeast display FACS cell gating background for the DuneX binder discovery case study

Case Study - Rapid Binder Discovery Against EGF

Rapid Binder Discovery Against EGF

6 sequence-confirmed binders identified from a compact 53-aa target, with the best clone showing an apparent yeast-display Kd of 17.12 nM. This pilot-scale yeast display case study demonstrates FACS enrichment, clone recovery, and dose-dependent binding against a compact, high-background antigen.

TargetEGF
Target Size53 aa
Binders6
Best App. Kd17.12 nM

Results

Six EGF binders recovered, with best apparent Kd around 17 nM.

Using the Nova-Intermediate-Coop library, the demo produced a measurable binder panel despite elevated secondary/background signal, supporting both the discovery workflow and next-round optimization strategy.

Key outcome

The best-performing clone reached an apparent yeast-display Kd of 17.12 nM in the EGF titration panel. Additional variants created a useful ranking set rather than a single isolated hit.

Recovered binder panel6 variants
Best apparent Kd17.12 nM
Concentration range tested1-300 nM
Selection evidenceR1-R4 FACS gates

What this shows

This case study demonstrates a complete early discovery loop: antigen staining, FACS enrichment, clone recovery, and clone-level titration. For client projects, the same structure can be expanded with alternate labels, competition sorting, off-rate selection, soluble reformatting, and orthogonal binding assays.

For small antigens like EGF, the most important next optimization is often reagent-background control, including alternate fluorophore/streptavidin formats and negative depletion against secondary reagents.

Open Dataset

See raw data here.

Review the original Yeast Display Demo repository for raw FCS files, gating strategy, NGS material, and clone binding curve assets behind this case study.

Open GitHub Dataset

Program Goal

Demonstrate rapid discovery against a small, high-background antigen.

EGF is a compact 53-amino-acid protein, making it a useful demonstration target for workflows where antigen size, labeling format, and secondary-reagent background can all affect apparent enrichment.

Goal

Recover binders suitable for clone ranking

The objective was not only to show enrichment, but to generate a small panel of individual binders that could be sequenced, re-tested, and ranked by concentration titration.
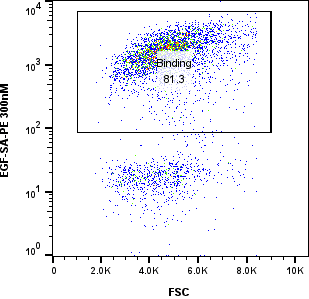
Challenge

Small target with elevated reagent background

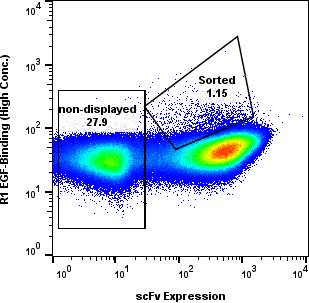
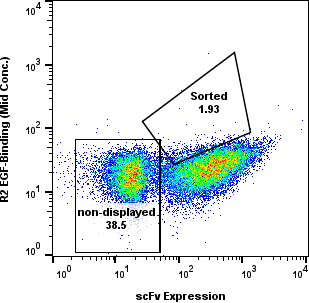
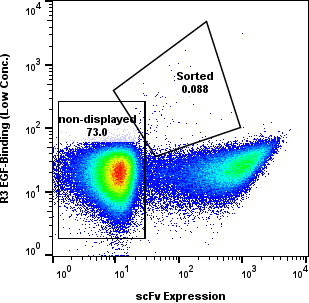
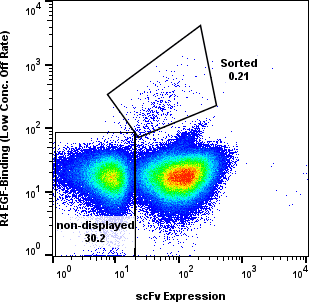
EGF-like targets can be sensitive to label orientation and streptavidin-PE background. The workflow emphasized gated populations, round-by-round enrichment, and secondary-background awareness.

Decision Point

Use discovery data to guide next optimization

The resulting binders provide a practical launch point for confirmatory assays, alternate labeling formats, off-rate selection, or affinity maturation when tighter binding is required.

Approach

Library screening, FACS enrichment, clone recovery, and binding titration.

The workflow combines yeast display selection with FACS-based gates and a final titration panel, converting an enriched population into individual clone-level binding data.

01 - Library

DuneX-Nova Intermediate-Coop

The synthetic scFv-format library was screened to identify EGF-reactive variants while maintaining a practical path to downstream sequence analysis and reformatting.

02 - Selection

Round-by-round FACS enrichment

Yeast cells were gated for clean populations and sorted across R1-R4. Enrichment gates prioritized antigen-positive events while tracking background.

03 - Characterization

Six-point EGF titration

Recovered clones were tested across 1-300 nM EGF to generate dose-response curves and estimate apparent yeast-display binding strength.

Selection Panels

Sorted gates across R1-R4 panels.

Round-level FACS plots show how antigen-positive populations were tracked and sorted during the discovery workflow.

EGF yeast display FACS R1 flow plot with non-displayed and sorted gates
R1 panelSorted 1.15%
EGF yeast display FACS R2 flow plot with non-displayed and sorted gates
R2 panelSorted 1.93%
EGF yeast display FACS R3 flow plot with non-displayed and sorted gates
R3 panelSorted 0.088%
EGF yeast display FACS R4 flow plot with non-displayed and sorted gates
R4 panelSorted 0.21%

Dose Series

Variant 1 raw dose series.

The tabs below let technical reviewers inspect the raw Variant 1 FACS gate behavior from 300 nM down to 1 nM.

Variant 1 EGF yeast display FACS binding gate at 300 nM EGF
300 nM EGFSaturation-range staining helps anchor the upper asymptote for apparent Kd estimation.

Typical Timeline

A pilot-scale binder discovery workflow in weeks, not months.

Actual timing depends on antigen availability, label format, confirmation depth, and whether soluble reformatting is included.

Week 0

Target intake

Review antigen format, labeling strategy, control reagents, and expected downstream use.

Weeks 1-2

FACS selection

Run sequential enrichment rounds with population gates, background checks, and sorted libraries.

Weeks 3-4

Clone recovery

Pick, sequence, and re-test enriched clones to identify unique candidate binders.

Weeks 4-6

Ranking package

Generate titration curves, apparent Kd estimates, and a prioritized binder panel.

Supporting Biotech Teams Worldwide from the San Francisco Bay Area

Share your target format, project goal, and desired binder profile. We’ll help map the fastest practical path toward a focused yeast display discovery campaign.

Contact Us